 “Drive for show, putt for dough” is not only a great axiom for playing golf, it can also be applied to your investment strategy. Investment strategies should be developed after a thorough understanding of your “risk tolerance”. Risk tolerance is the ability to accept risk (based on unique circumstances), and willingness to accept risk (based on observations and experiences). The willingness to accept risk and the ability to accept risk are sometimes at odds. Once defined, an investment strategy should target an asset allocation that provides the highest expected return for an identified level of risk. Since this is where the “rubber hits the road” in the financial planning process, let’s jump in and go for a drive.
First, we need to state the obvious – “no one knows the future”. All the analytical models and all talking heads in all the gin joints in all the towns in all the world have no idea where the markets are heading. But we do have history on our side. Historical observations provide Wall Street with standard deviations (risk) and expected returns. But analyzing the past is very limiting. It’s analogous to driving down the highway looking backwards through the rearview mirror. It can be done, albeit slowly and conservatively. Increasing speed increases risk. Assuming the road remains straight, you’ll certainly reach your destination. However, as the road turns you may not have time to recognize the change and adjust accordingly. More importantly, if momentum carries the car off the highway, you’ll want to survive the crash!
So if “risk” is the speed we are traveling down the road while navigating with the rearview mirror of history, how do we know what the correct speed limit is? The correct speed limit will be determined by our defined risk tolerance. Wall Street can provide many analytical measures of risk. Implied forward volatility can be measured by the CBOE Volatility Index (VIX). Historical measures include beta (Î ²), standard deviation (Ý) and value-at-risk (VaR). However, these measures of risk are constantly changing and require interpretation. In reality, risk tolerance is a subjective opinion based on personal experiences and observations. Predefined risk metrics are simply a tool used to help formulate our opinion.
Risk tolerance is also influenced by investment objectives. When defining the risk speed limit, what is more important – the return on capital, or the return of capital? In other words, do you want to maintain the purchasing power of your invested capital, or are you looking to increase your purchasing power? A good-rule-of-thumb is that risk assets such as stocks tend to increase purchasing power, while lower-risk assets such as bonds tend to maintain purchasing power.
To illustrate, let’s drive for a show with a new BMW instead of a driver. Currently, a new 2018 BMW 5 Series retails for about $52,650 (it is easy to get car invoice prices online for any model these days). You have the money, and would like to buy the car, but you don’t need a car anytime soon. If you invested $52,650 in a 5-year, high-quality bond, you should have adequate cash at maturity to buy a new 2023 BMW 5 Series after inflation. Bonds are essentially priced to maintain the purchasing power of invested capital by rewarding the investor with a return that slightly exceeds the expected level of inflation over the maturity (timeframe) of the bond. The amount of excess return offered to investors is determined by the quality rating (risk level) of the issuer.
However, if you would rather buy a higher-class BMW, you will need to accept more risk in order to increase your purchasing power. According to Morningstar, stocks averaged roughly 10% a year from 1926-2016. Assuming you can match the stock market’s long-term historical returns and inflation remains near 2%, your purchasing power would increase to a level where you could afford a 6 Series in four years, or a 7 Series in six years. BUT, you must be willing to settle for a BMW 3 Series! In other words, you must be willing to lose money over this time frame. In six years, even if your original stock market investment declined by 25%, you would still be able to purchase a BMW 3 Series adjusted for inflation. If you can live with the downside risk of driving a 3 Series, then you have the willingness and ability to accept the risks associated with an equity allocation. If not, stick with bonds and continue dreaming of your future 5 Series “Bimmer”. By the way, the correct spelling of the term for a BMW car is Bimmer. The correct spelling for BMW motorcycles is either Beamer or Beemer. Please don’t ask me to explain why.
So how can we match our risk tolerance (speed limit) with the highest possible expected return? By building a well-diversified portfolio that intersects the “efficient frontier”. The efficient frontier is a graphical representation of the risk/return tradeoffs for various optimized portfolios and is essentially our speedometer. The efficient frontier depicted in figure 1 plots various asset allocations according to historical risk/return observations. The lower left depicts portfolios with low risk and corresponding lower expected returns. As the curve bends up and to the right, the expected return increases as well as the associated risk. Of note, the portfolio at the bottom of the graph which plots a 100% allocation to bonds is less efficient than a portfolio with 33% stocks. Also note that the efficient frontier begins to flatten as you increase risk substantially. This graphically depicts the fact that the most efficient portfolios are a diversified collection of assets (cash, stocks, bond, alternatives, etc.) that have limited correlations.
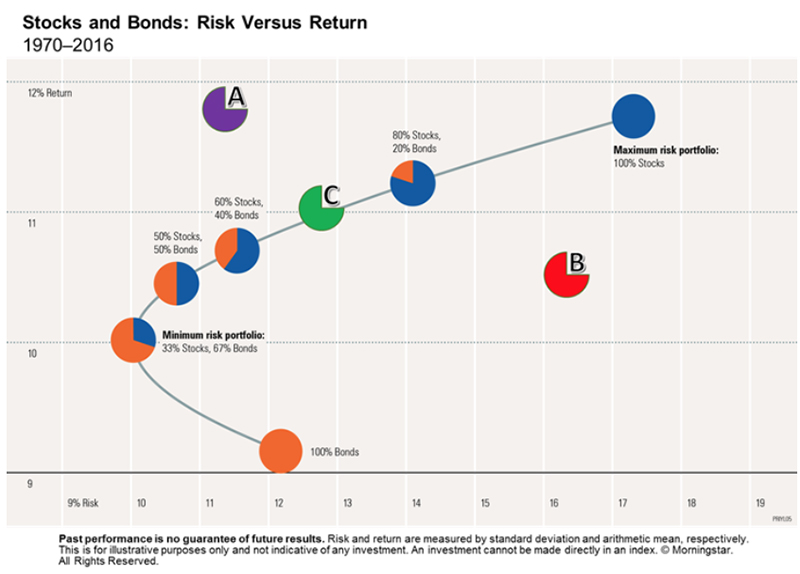
- Portfolio A represents a non-investable portfolio. There is no combination of assets that can provide an investor with this risk/return opportunity. Be wary of the fact that it is impossible to build a portfolio that rises above the efficient frontier, but it is not impossible to be promised unreachable returns for various levels of risk.
- Portfolio B represents a portfolio that falls below the line is considered an inefficient portfolio in need of an overhaul! It provides the investor with too little return given the risk the investor is willing to absorb. Unfortunately most retail investors maintain portfolios below the line.
- Portfolio C is one of the allocations that intersects the efficient frontier and is optimized to deliver the highest expected return possible for the associated level of risk. A portfolio with a risk/return profile that intersects the efficient frontier is what every investment strategy should target.
The goal of financial planning is to place the investor on the fairway of the efficient frontier. As noted, risk tolerance is a subjective determination, and therefore the process of identifying risk tolerance is more of an art than a science. However, investors should always follow a well-defined process of developing and implementing an investment strategy. There are no Mulligan’s in financial planning. The more effort you put towards the planning phases of the investment cycle, the more fairways you’ll hit! Once on the green, putting for dough requires steady, competent portfolio management. The markets, like greens, can be hard to read. But if you have accurately identified your risk tolerance and return objectives, you will probably be left with a very short putt. And if you sink the putt and collect your earnings, enjoy the ride home in that new Bimmer!
Le Keough, CFA, CPA, CFP
Raymond James & Associates
www.raymondjames.com/lekeough
512-306-2560
Views expressed in this newsletter are the current opinion of the author, but not necessarily those of Raymond James & Associates. The author’s opinions are subject to change without notice. Information contained in this report was received from sources believed to be reliable, but accuracy is not guaranteed. Information provided is general in nature, and is not a complete statement of all information necessary for making an investment decision, and is not a recommendation or a solicitation to buy or sell any security. Past performance is not indicative of future results. There is no assurance these trends will continue or that forecasts mentioned will occur. Diversification and strategic asset allocation do not ensure a profit or protect against a loss. Fixed income investments may involve risks including market risk if sold prior to maturity, credit risk, reinvestment risk and interest rate risk. Standard deviation is a risk statistic used to measure the amount of volatility of the return observations around the portfolio’s average return. VIX is the Chicago Board Options Exchange (CBOE) Volatility Index, which shows the market’s expectation of 30-day volatility. It is constructed using the implied volatilities of a wide range of S&P 500 index options. It is a widely used measure of market risk. Beta compares volatility of a security with an index, such as the S&P 500. A beta of one means the security has volatility equal to that of an index. Investing always involves risk and you may incur a profit or loss. No investment strategy can guarantee success. Raymond James & Associates, Inc., Member New York Stock Exchange/SIPC